Liverpool are still good, and so is MUFC’s De Gea.

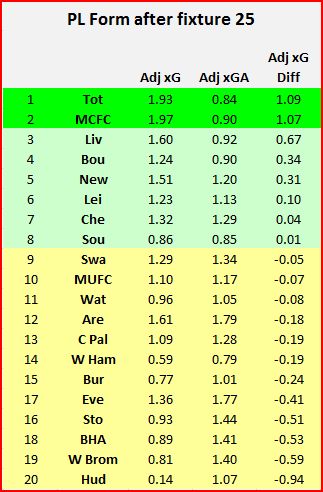
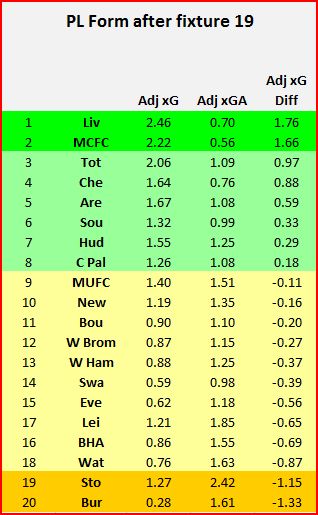
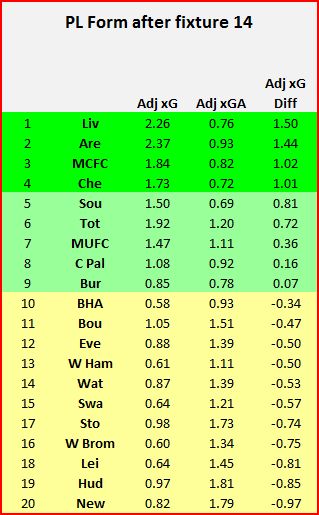
On 20th October last year, after eight rounds of the current Premier League season, I wrote ‘Liverpool are good!’.  Since round twelve, Liverpool have occupied second place continuously in the Expected Goals (xG) table.

Some questions remain about Liverpool’s defence, despite the addition of Virgil Van Dijk, but MUFC and Chelsea must now be looking over their shoulders’ in the fight for second place.

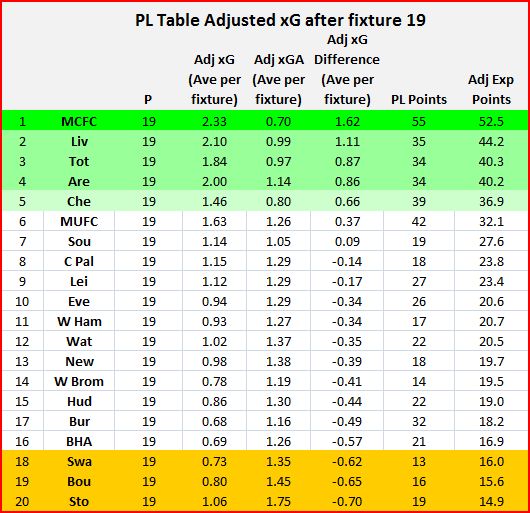
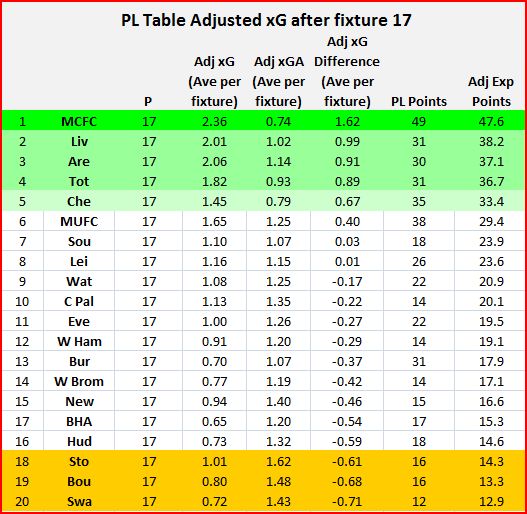
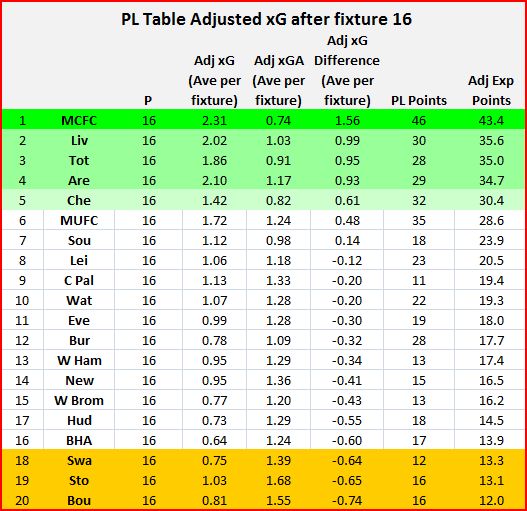
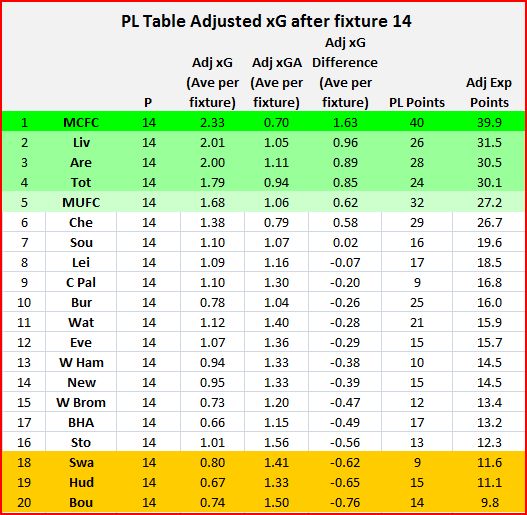
The table highlights teams that are significantly out-performing and under-performing xG. MUFC are the standout team, with 13.7 more PL points than Expected Points (xP). Is this a positive or a negative for MUFC? It is positive that the team is exceedingly efficient at getting results relative to the balance of chances created and conceded. On the negative side, questions remain about the ability to maintain this out-performance for a full season, although history shows that it is doable over a thirty eight game season. Over the longer term, the difference between performances and xG tends to revert to the mean.


Football 27 Table


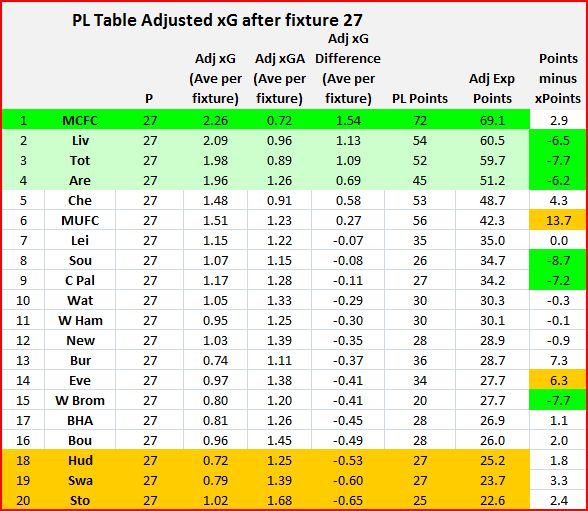
Manchester United have scored six goals more than xG, and have conceded an incredible sixteen fewer goals than Expected Goals Against (xGA), seventeen conceded for xGA of 33. This is not all a result of the performance of the goalkeeper De Gea, but a sizeable chunk of this difference (the exact proportion is currently unmeasurable) is a result of the effectiveness of the Goalkeeper.

Everton are also significantly outperforming xG.

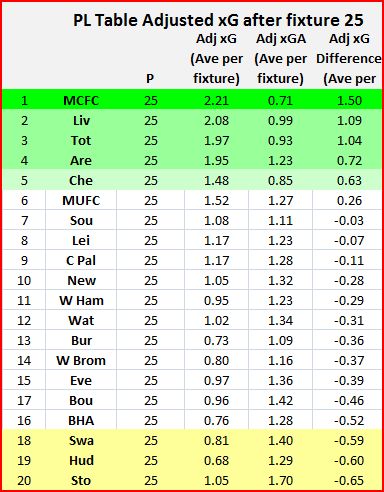
On the underperformance side, Liverpool (2nd), Tottenham (3rd) and Arsenal (4th) are underperforming their xG by 6 – 8 PL points each. If the table was based on xG, MCFC lead by 8.6 points, and the title is not yet sewn up!

Southampton, Palace and West Brom are also significantly under-performing xG.


Football 27 perf


Football 26 perf


Performances PL fixtures 20 – 25

Football 25 perf


Arsenal’s performance away to Swansea in fixture 25 was 20th, having topped the performances in week 24 against Crystal Palace.

The form of the twenty teams is currently the most closely bunched of the season, with a standard deviation of the twenty team’s current form of 0.52 xG Difference.

Southampton are significantly under-performing expected goals.


Football 25 form


Football 25 table


Football 24 perf


Football 23 perf


Football 22 perf


Football 21 perf

Football 20 perf


PL Week 17 Expected Goals performance, form and table

Football 17 Perf


Football 17 Form


Football 17 table


After their slight ‘blip’, where their form dropped back to top four form for three fixtures, Manchester City are back leading all three tables.

Leicester and Southampton have been battling for the ‘best of the rest’ (seventh place), throughout the season. Leicester’s 1 – 4 away victory over Southampton gives the edge to Leicester. Writing this after the early match in round 18, Leicester have lost 0 – 3 at home to Crystal Palace. Palace are now getting results consistent with their Expected Goals numbers. Palace are tenth in the Expected Goals table, and have been a solid mid-table team throughout the season by this measure of football performance.

Looking at the top versus the bottom teams, the gap between fourth (Tottenham) and the average team (+0.89 adjusted xG difference) is greater than the gap between the bottom team (Swansea) and the average PL team (-0.71 adjusted xG difference). The gap between sixth and seventh (0.37 adjusted xG difference) is greater than the gap between Burnley in thirteenth and Swansea in twentieth (0.34 adjusted xG difference).

Of the four teams between 9th ans 12th, three (Crystal Palace, Everton and West Ham) have spent the majority of the season either in the bottom three or hovering close to the bottom three, while in mid-table in terms of Expected Goals. Everton and Palace are now approaching a position in the PL table consistent with their Expected Goals. I expect West Ham to do likewise.

Premier League Week 15 Performances and Form

Football 15 Form

Arsenal lead the form table, with MCFC falling to fourth. Arsenal recorded xG – xGA of 4.6 – 1.9 in their home fixture against MUFC. Taking account of the form of the opposition and playing at home this is adjusted to 4.27 – 2.00. MUFC’s adjusted xG for this fixture is 2.51 – 3.16. MUFC are performing much better in terms of goals scored and conceded than adjusted xG, worth seven goals over the past five fixtures.

Liverpool continue to be in very good form, having usurped MCFC to lead the form table last week, and second to Arsenal this week. Liverpool are also second in the Adjusted xG table for the season. Their 7-0 win in the Champion’s League midweek reflects their good attacking form.

Arsenal’s next opponents, Southampton away, have top six form currently, and will be a test of Arsenal’s current good form.

Football 15 PL performances

Premier League top six are 30 PL points better than last season

Football fix 15 table


MCFC, MUFC, Liverpool, Tottenham and Chelsea have all qualified for the knock-out phase of the Champion’s League, with four of these winning their groups. Premier League teams have won half of the eight CL groups. So, are the PL top six really that good, and are they that much better than last season?

The answer to the second question is yes. The PL top six have achieved an average expected goals difference (xG Difference) this season of 0.92 xG Difference per fixture. Their average for the whole of last season was 0.77. The difference of 0.15 xG Difference per fixture is equivalent to 5.7 expected goals difference over a 38 match season, or 5 PL points at the current PL average rate of conversion of xG difference to PL points. This extrapolates to 30 more PL points won by the top six over a 38 game season.

I have assumed that xG difference will be converted to actual goal difference, and that goal difference will convert to PL points at the average PL rate. While individual teams may out-perform or under-perform xG, a group of six teams on average are more likely to perform close to xG. The table above shows that the top six are underperforming xG by a total of seven points currently (approx 1.2 points each), on the basis of xG Difference converted to PL points-equivalent at the average rate of conversion in the PL this season.

xG has been shown to be a better predictor of future performance than shots on goal or actual goals scored. I have extrapolated from this that xG is a good indicator of the underlying quality of PL teams. It is of course not perfect. Crystal Palace are tenth in the table above, and have been a solid mid-table team for almost all of this season by this measure, despite spending most of the season rooted at the bottom of the PL table. Palace have begun to get better results in their most recent three games. While teams can out-perform or under-perform xG, sometimes for significant periods of the season, eventually it is likely that their performances will revert to close to underlying xG. A bold prediction here: Palace will not be relegated at the end of the season.

Burnley are another side that seem to defy xG. This continues a trend from last season. Burnley have a defensive record that defies xGA (the quality and number of shots conceded). As discussed in previous posts, Burnley are conceding very low quality shots, averaging 0.07 xGA per shot conceded (PL average this season is 0.105), and defending these very well (10 non-penalty goals conceded for xGA of 18.3).

The average xG Difference per fixture for the the top six this season at 0.92 xG Difference is better than Chelsea’s title winning average of last season, which was 0.84. Although MCFC achieved a higher average xG Difference last season (MCFC were let down by conceding more goals than xGA, and scoring fewer than xG last season), on average the top six are better than good enough to win the PL. It is not surprising that all six are performing well in European competition.


Premier League Week 14. Performances, form and table Expected Goals (xG)

Football fix 14 perf


Tottenham are third here despite losing their last fixture away to Leicester. The measured xG for Lei 2 – Tot 1 was 0.8 – 2.5. This was a game in which Spurs ‘won’ the game on xG, in other words on this occasion finishing let them down.


Football fix 14 form


The above ia a PL form table as measured by adjusted xG. MCFC have led this table for the past nine weeks, and fall to third currently. This may be a good time to play MCFC, if there is ever a good time to play Pep Guardiola’s side this season. Perhaps this offers a glimmer of hope for the the other five of the ‘big six’ that the title race might not already be completely sewn up by MCFC.

Arsenal’s position in the form table as measured by this method after the past four fixtures has been 2nd, 3rd, 2nd and 2nd. Although MUFC’s form is a little lower by this measure, Mourinho’s team continue to get results in the efficient way that Mourinho teams tend to do. They have been attacking less well in recent fixtures. In their first five fixtures of the season, average adjusted xG was 2.42, compared to 1.29 in the subsequent nine fixtures. Defensively, average adjusted xGA in earlier fixtures compared to more recent fixtures was 0.87 compared to 1.17. Over the season, MUFC are significantly over-performing xG in the attacking and defensive parts of their game. Mourinho’s team have scored six more NP (non-penalty) goals than xG (30 vs 24), and conceded eight fewer than xGA (7 non-penalty goals conceded compared to xGA of 15). However Are vs MUFC should be a fascinating prospect for both teams supporters and neutrals alike.


Football fix 14 table


Liverpool have been second in the adjusted xG table for the past three weeks and are currently fifth in the PL table. Their achilles heel is defending, although perhaps this aspect of their play is not as poor as last season, having conceded 3.3 more goals than xGA, 18 NP goals conceded compared to xGA of 14.7.

Crystal Palace have been performing consistently at the level of a solid mid-table team. In recent games their results have begun to reflect this.

Premier League week 13: Adjusted Expected Goals (xG) performance and table

Football Week 13 table


The gap from Manchester City to second placed Liverpool is 0.85 adjusted xG per fixture, the same as the gap between Liverpool and the average PL team.

The gap between sixth (Chelsea) and seventh (Leicester) is 0.5 adjusted xG per fixture, equivalent to six PL points equivalent.

Apart from the top six, only Leicester have a positive adjusted xG difference. A positive xG difference implies the team is performing better than the average PL team this season.

Only 5 PL points equivalent separates ninth from ninteenth.


Adjusted expected Goals is a measure of performance in football matches using expected goals and adjusting for the quality of the opponent (at the time the game is played) and home and away fixtures. Expected goals (xG) is a better indicator of future performance in football matches than shots or even actual goals scored.


Football week 13 perfs


This was Manchester City’s poorest performance this season by this measure of performance. Everton are worse under the current Manager than under Koeman. The toffees were doing well on this measure of form under Koeman, but were not converting chances at the standard rate, and were conceding more than the average number of goals relative to chances conceded. The failure of Everton to do well in the PL during Koeman’s period in charge this season is a result of imbalance and specific weaknesses in the team, and can be put down to the Club’s poor performance in the Summer transfer window despite spending heavily.

Newcastle’s form has suffered a worrying nose-dive in recent matches.